
October’s housing reports were released in mid-November, and they show a slower market almost everywhere. Fewer properties changed hands than a year ago. Prices, though, held up better than sales did, and San Bernardino County’s median price was slightly higher than last year. Here is what the numbers say, where each one comes from, and what they may mean if you are thinking about selling.
The national picture
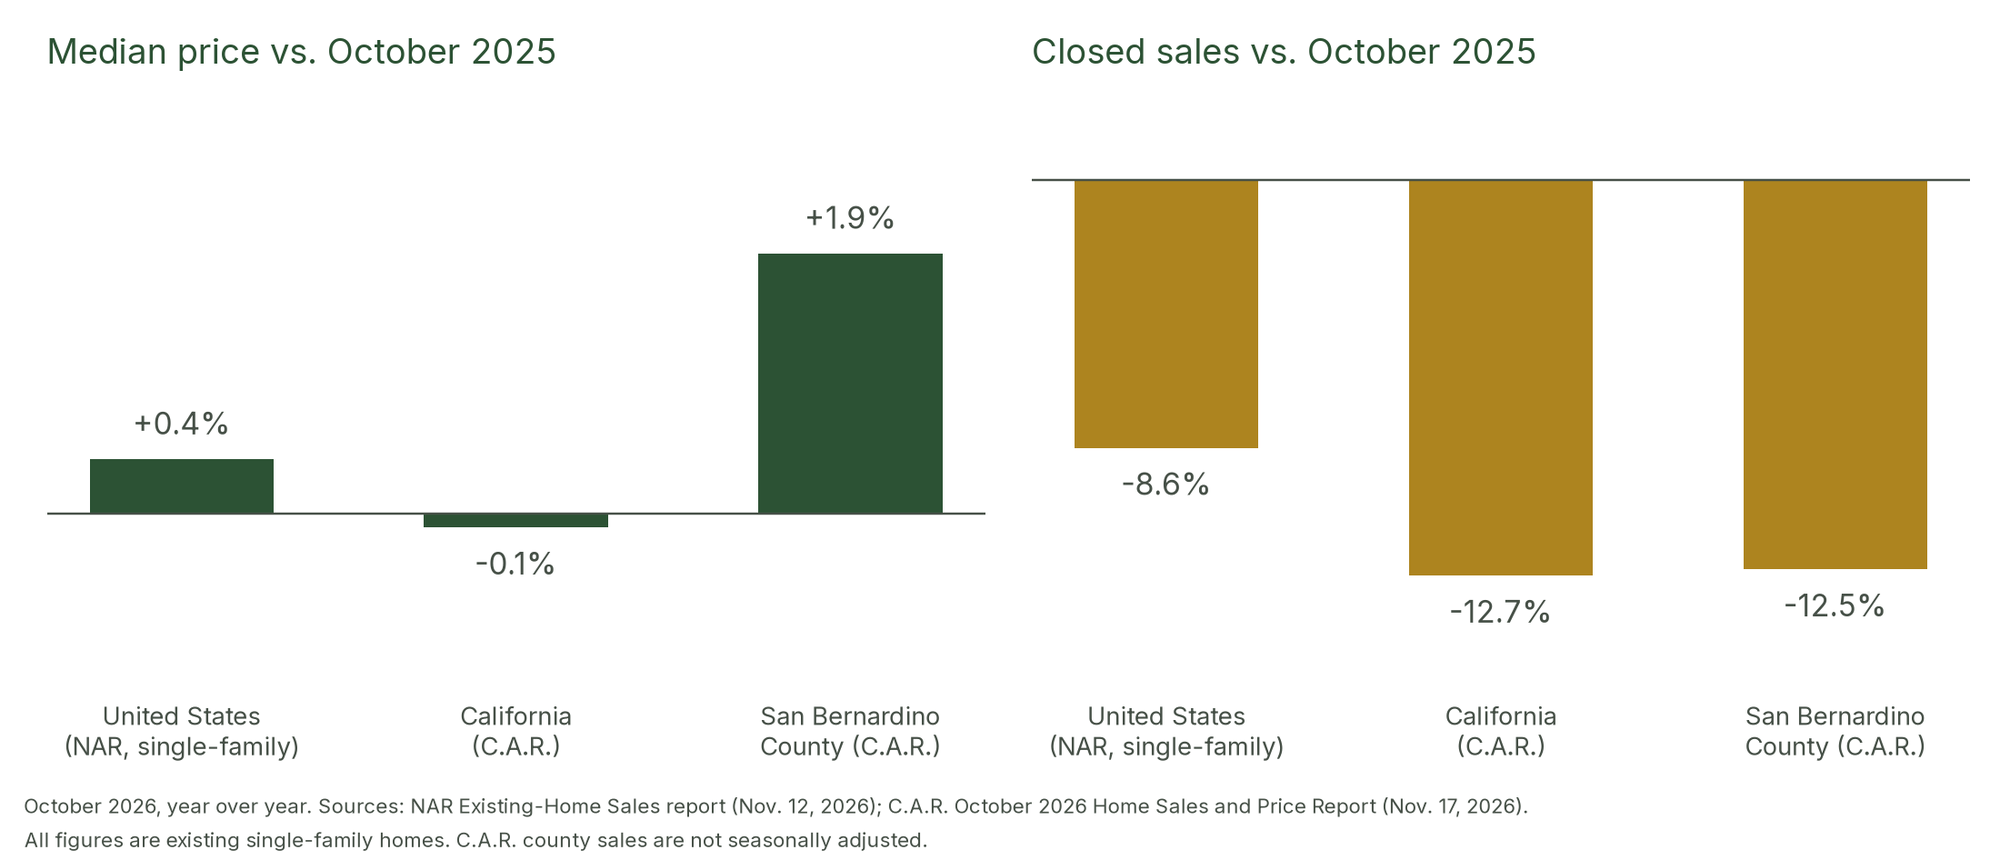
The National Association of REALTORS® (NAR) reported on November 12, 2026, that existing-home sales fell to a seasonally adjusted annual rate of 3.75 million in October. That is 8.8% lower than October 2025 and, according to NAR Chief Economist Lawrence Yun, the lowest level since August 2010. The national median existing-home price was $416,700, up 0.4% from a year earlier. For single-family homes alone, which are the figures used in the table below, the median was $421,900 (up 0.4%) and sales were down 8.6%.
Signed contracts point the same direction. On November 18, 2026, NAR reported that pending home sales fell 4.7% from September and 16.7% from October 2025. Real Estate News described the result as a three-decade low, and Yun said “annual existing-home sales could be the lowest since the mid-1990s.”
California
The California Association of REALTORS® (C.A.R.) reported on November 17, 2026, that existing single-family home sales reached a seasonally adjusted annual rate of 246,830 in October. That is 12.7% below October 2025 and the lowest level in nearly three years.
The statewide median price was $886,760, essentially unchanged from $887,330 a year earlier. Active listings were 6.6% higher than in October 2025, and C.A.R.’s Unsold Inventory Index rose to 3.8 months from 3.2 months a year ago.
San Bernardino County
In the same C.A.R. report, San Bernardino County’s median price for existing single-family homes was $501,510 in October. That is 1.9% higher than October 2025 ($491,970). It is also 5.6% lower than September’s $531,090. Monthly medians move around, and a single month should not be read as a trend.
County sales were 12.5% lower than a year ago and 2.7% lower than in September (C.A.R. county sales figures are not seasonally adjusted). Supply grew: the county’s Unsold Inventory Index was 5.3 months, compared with 4.6 months in October 2025. At the same time, the median time to sell was 37 days, down from 46 days a year earlier.
For regional context, C.A.R. reported an Inland Empire median of $577,440 (down 3.7% from a year ago) with sales down 18.4%. Riverside County’s median was $610,000 (down 3.9%), with sales down 21.4%.
Side by side
October 2026
- Median price. United States: $421,900; California: $886,760; San Bernardino County: $501,510
- Change from Oct. 2025. United States: +0.4%; California: Essentially unchanged; San Bernardino County: +1.9%
- Closed sales vs. Oct. 2025. United States: -8.6%; California: -12.7%; San Bernardino County: -12.5%
- Months of supply (a year ago). United States: 5.1 (4.4)*; California: 3.8 (3.2); San Bernardino County: 5.3 (4.6)
- Median days on market (a year ago). United States: 35 (34)*; California: 29 (32); San Bernardino County: 37 (46)
U.S. median price and sales are NAR’s single-family figures (Nov. 12, 2026). *U.S. months of supply and days on market cover all existing-home types (NAR; days on market from NAR’s REALTORS® Confidence Index). California and San Bernardino County figures are existing single-family homes from C.A.R. (Nov. 17, 2026).
A closer look at our area
The Inland Valley Association of REALTORS® (IVAR) publishes a monthly report using California Regional Multiple Listing Service data for its own service area, which includes cities across the Inland Empire and some in eastern Los Angeles County. These are IVAR service-area figures, not San Bernardino County totals. For October 2026, IVAR reported 2,012 pending sales, compared with 2,507 a year earlier (down 19.7%), and new listings down 15.1%. The sold-price-to-list-price ratio was 98.7%, and days on market were 28.
What this may mean if you are thinking of selling
Taken together, the reports describe a market with fewer sales but steady prices. In October, San Bernardino County’s median price held up better year over year than both the national and statewide medians, and properties there sold faster than a year ago. There is also more supply than last year, which gives buyers more choices and more room to negotiate.
In practice, that makes pricing and preparation more important. IVAR’s 98.7% sold-to-list ratio shows that, across its service area, sales were still closing near asking price. A property priced in line with recent comparable sales is in a better position than one priced well above the evidence, which now competes against more alternatives than it would have a year ago. Every property and neighborhood is different, so countywide numbers are a starting point, not a valuation.
Questions about your property?
If you would like to talk through what these numbers mean for your property, DayBreak Group is glad to help, with no obligation. We serve clients in English and Spanish, and we are happy to meet at your home when that is more convenient.
Call 909-575-8812, email Brett@DayBreakGroup.com, or reach us on our Contact page. You are also welcome to start with our Personal Property Value page.
We Make House Calls.
Brett Dunne, Broker/CEO | DRE #01458890
DayBreak Group | Brokerage DRE #02127732
Sources
- Existing-Home Sales Decreased 5.5% in October, According to NAR Report, National Association of REALTORS®, November 12, 2026
- November 2026 Monthly Research Update, National Association of REALTORS®, November 18, 2026
- Winter market looks grim as pending sales hit 3-decade low, Real Estate News, November 18, 2026
- October 2026 Home Sales and Price Report, California Association of REALTORS®, November 17, 2026
- October 2026 Housing Data Report, Inland Valley Association of REALTORS® (CRMLS data), November 2026