
Countywide numbers are useful, but many property owners want to know what happened in their own city. The Inland Valley Association of REALTORS® (IVAR) publishes a monthly city overview based on California Regional MLS (CRMLS) data. Here is what its October 2026 report shows for three neighboring cities. Every figure below comes from that report.
Rialto
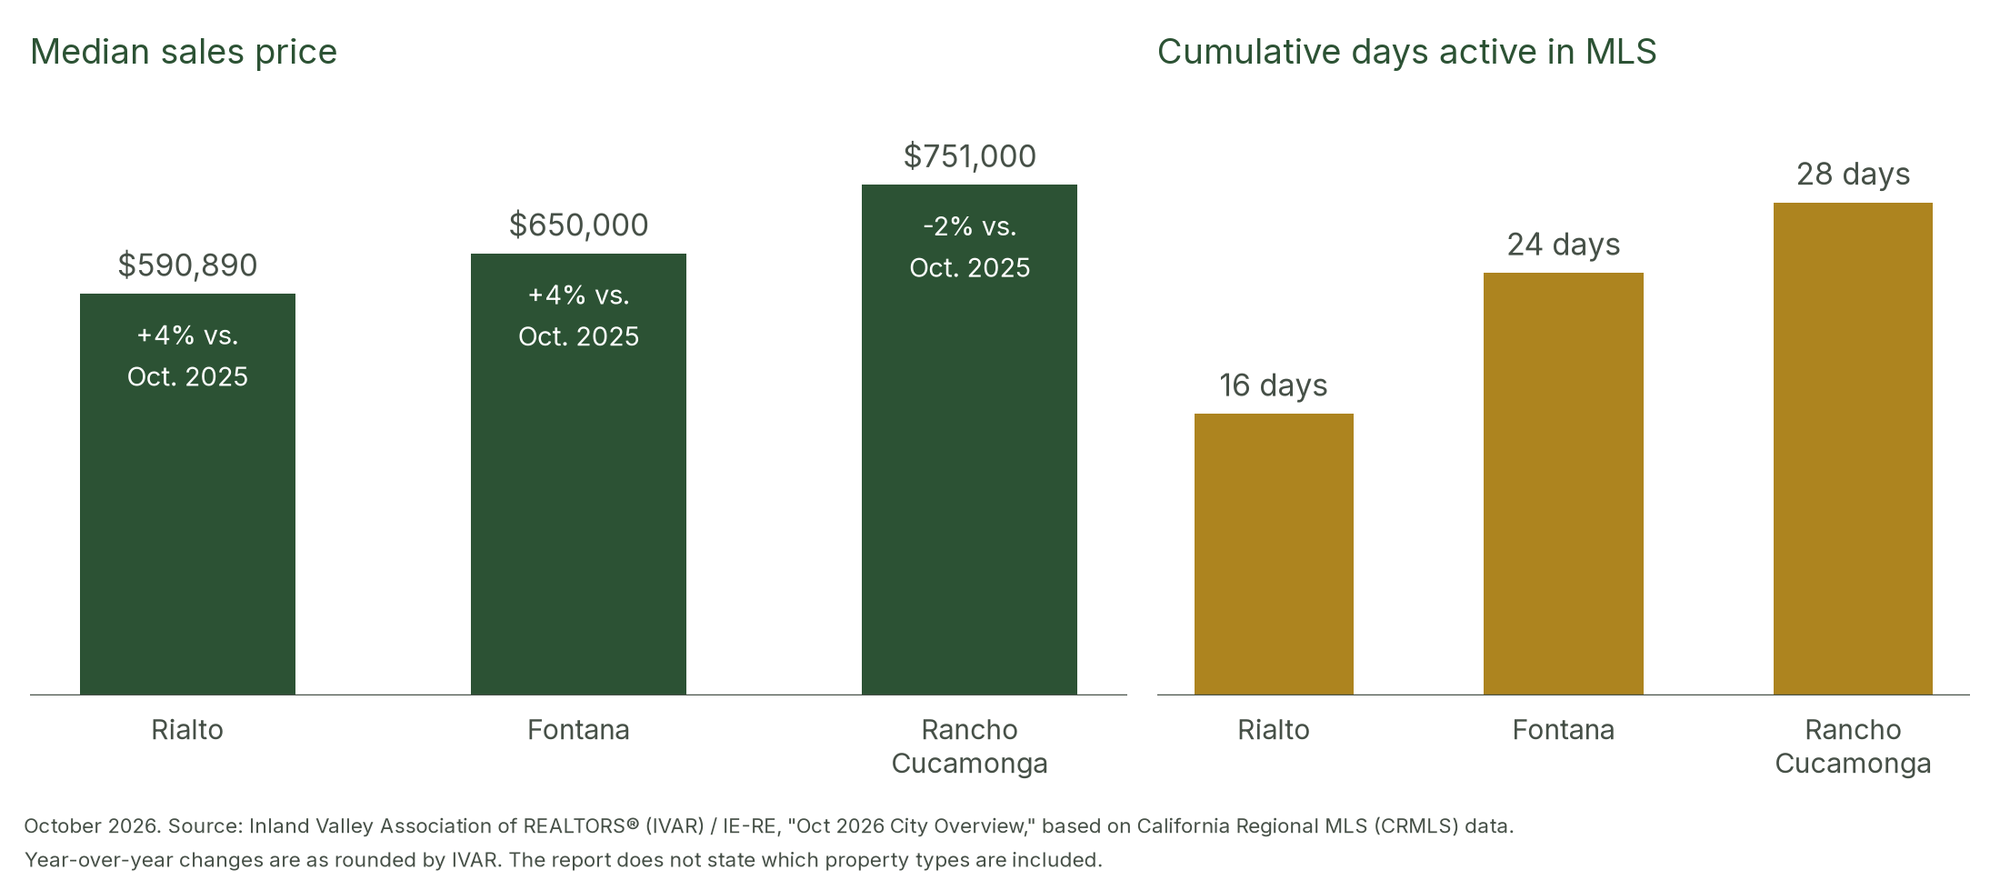
According to IVAR’s October 2026 report, Rialto’s median sales price was $590,890, up 4% from October 2025. Sales transactions were down 5% from a year earlier, with 41 closed sales in the month. The city had 73 active listings, and the price per square foot was $358. Cumulative days active in MLS were 16, the shortest of the three cities.
Fontana
Fontana’s median sales price was $650,000 in October, also up 4% from a year earlier, IVAR reported. Fontana was the only one of the three with more sales than a year ago: transactions rose 12%, with 101 closed sales. There were 200 active listings, the price per square foot was $352, and cumulative days active in MLS were 24.
Rancho Cucamonga
In Rancho Cucamonga, IVAR reported a median sales price of $751,000, down 2% from October 2025. Sales transactions were 37% lower than a year earlier, with 74 closed sales. The city had 158 active listings, a price per square foot of $410, and 28 cumulative days active in MLS.
Side by side
October 2026
- Median sales price. Rialto: $590,890; Fontana: $650,000; Rancho Cucamonga: $751,000
- Median price vs. Oct. 2025. Rialto: +4%; Fontana: +4%; Rancho Cucamonga: -2%
- Sales transactions vs. Oct. 2025. Rialto: -5%; Fontana: +12%; Rancho Cucamonga: -37%
- Closed sales in October. Rialto: 41; Fontana: 101; Rancho Cucamonga: 74
- Active listings. Rialto: 73; Fontana: 200; Rancho Cucamonga: 158
- Price per square foot. Rialto: $358; Fontana: $352; Rancho Cucamonga: $410
- Cumulative days active in MLS. Rialto: 16; Fontana: 24; Rancho Cucamonga: 28
Source: IVAR October 2026 Housing Data Report (CRMLS data), “Oct 2026 City Overview”; closed-sale counts from “Oct 2026 – Sales Volume per City.” Percent changes rounded as published.
Reading these numbers carefully
One month of city data covers relatively few sales; Rialto’s October figures rest on 41 closings. With samples that small, a handful of larger or smaller properties can move the median, and the numbers can swing from month to month. They are a snapshot, not a trend.
IVAR’s report does not say which property types are included, so it is not clear whether condominiums and townhomes are counted alongside single-family properties. It also does not say whether price per square foot and cumulative days active in MLS are medians or averages, or define the days measure further, so it may not match other days-on-market figures.
What this may mean if you are thinking of selling
In October, Rialto had the lowest cumulative days active in MLS, while Rancho Cucamonga had the largest drop in sales compared with a year ago. For any single property, recent comparable sales on nearby streets, condition and current competition will say more than a citywide median.
Questions about your property?
If you would like to talk through what these numbers mean for your property, DayBreak Group is glad to help, with no obligation. We serve clients in English and Spanish, and we are happy to meet at your home when that is more convenient.
Call 909-575-8812, email Brett@DayBreakGroup.com, or reach us on our Contact page. You are also welcome to start with our Personal Property Value page.
We Make House Calls.
Brett Dunne, Broker/CEO | DRE #01458890
DayBreak Group | Brokerage DRE #02127732
Sources
- October 2026 IE-RE Housing Data Report, Inland Valley Association of REALTORS® (IVAR), CRMLS data, November 2026